Nationwide’s poor voter turnout shows the feeling isn’t mutual (The Times)
The below article was published today in The Times comment section.
Two accompanying charts didn’t make the online version. The source data is here.
Chart 1: 2025 AGM voting participation
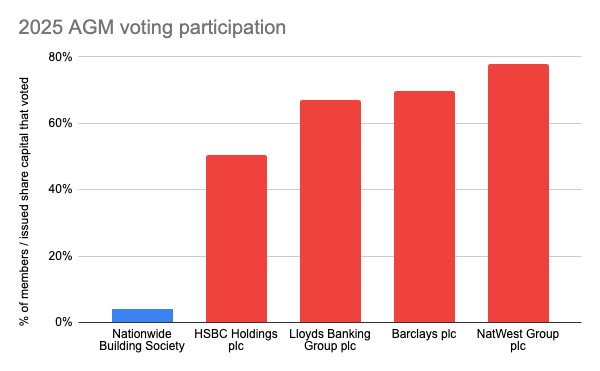
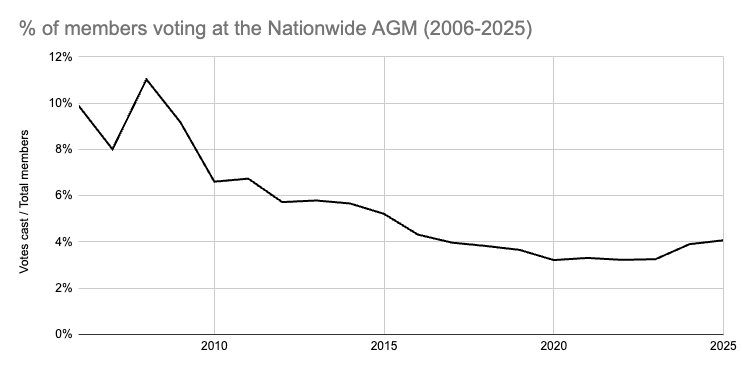
Chart 2: % of members voting at the Nationwide AGM (2006-2025)
Update 22 April 2026
I have now had the opportunity to place Nationwide in context of the wider building society sector, comparing the % of total members (using the BSA Yearbook 2025/26 as the source) that cast a vote at the last AGM (using voting results captured from individual society’s websites). Nationwide ranks 26th out of 39 when ranked by % of total members voting at the last AGM (googlesheet).
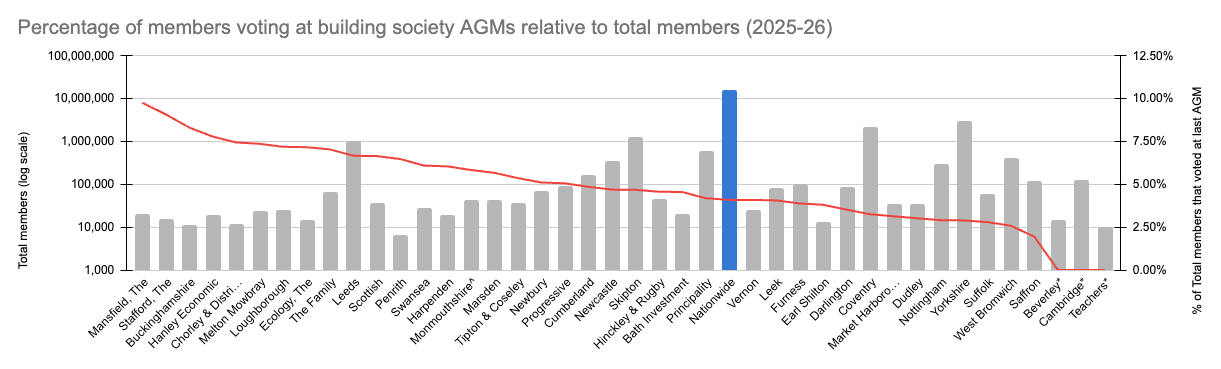
Very few building society’s publish information regarding the turnout expressed as a % of eligible members voting. Special mention goes to the following:
| Building society | % of eligible member voting |
| Loughborough | 10.90% |
| Swansea | 10.20% |
| Skipton | 7.10% |
| Yorkshire | 6.59% |
| Monmouthshire^ | 5.66% |
| Coventry | 5.60% |
| Nottingham | 5.22% |
| West Bromwich | 5.20% |
| Market Harborough | 5.17% |
^Clarity sought given anomalous (>100%) eligibility members / total members figure when compared to BSA data.
*Voting data requested, unavailable via web search